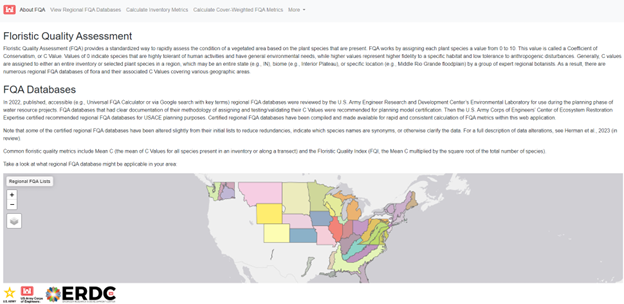
Floristic Quality Assessment (FQA) provides a standardized method of rapidly assessing the condition of a vegetated area based on the plant species that are present. FQA works by assigning each plant species a value from 0 to 10. This value is called a Coefficient of Conservatism, or C Value. Values of 0 indicate species that are highly tolerant of human activities and have general environmental needs, while higher values represent higher fidelity to a specific habitat and low tolerance to anthropogenic disturbances. Common floristic quality metrics include Mean C (the mean of C Values for all species present in an inventory or along a transect) and the Floristic Quality Index (FQI, the Mean C multiplied by the square root of the total number of species).
Generally, C values are assigned to either an entire inventory or selected plant species in a region, which may be an entire state (e.g., IN), biome (e.g., Interior Plateau) or specific location (e.g., Middle Rio Grande floodplain) by a group of expert regional botanists. As a result, there are numerous regional FQA databases of flora and their associated C Values covering various geographic areas.
The Integrated Ecological Modeling team at the U.S. Army Engineer Research and Development Center has developed and released two R packages designed to help users with FQA. One package, ‘fqadata’, stores each of the USACE planning model certified regional FQA databases. The second package, ‘fqacalc’, allows users to calculate floristic quality metrics. Both packages are available on CRAN (The Comprehensive R Archive Network) and can be installed locally.
If you would like to use FQA online, please visit our user interface at usace-ecomod.shinyapps.io/fqa_app/

